Acamdemic Project
Analyzing Urban Energy Use for the City of New York
NYU, Center for Urban Science and Progress, 2015
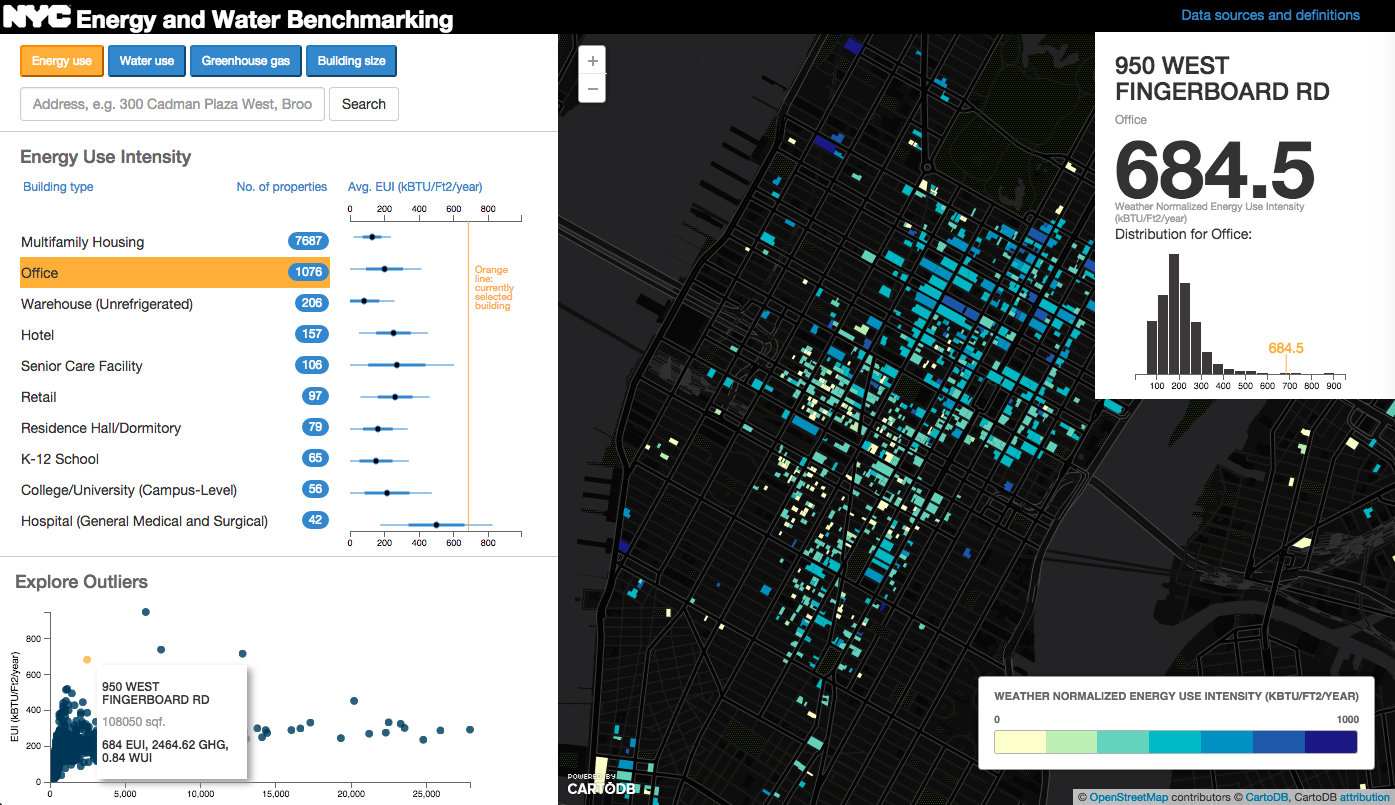
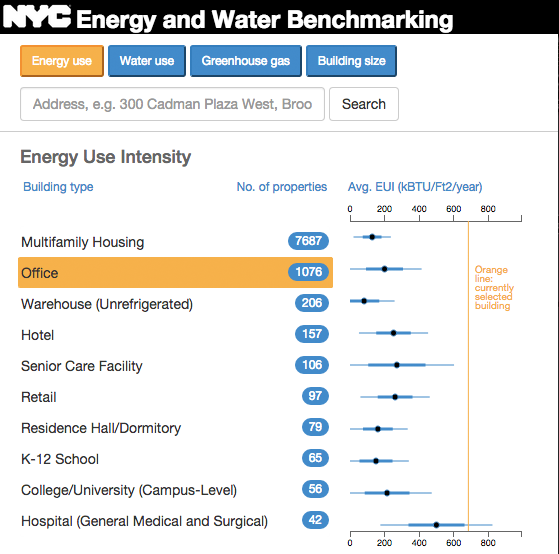
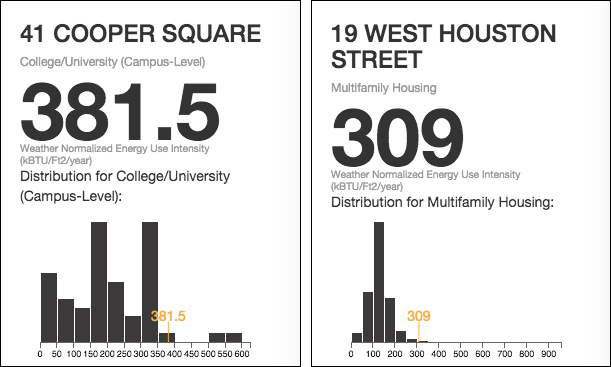
The browser-based visualization tool EnergyVis enables users to explore energy and water consumption patterns, green house gas emissions and building sizes of different building categories in New York City. Users can benchmark specific buildings against peer buildings, examine outliers and discover the effects of water and energy consumption on greenhouse gas emissions.
My role:
Managing a team of 3 and visualizing building energy and water consumption for the New York City Mayor’s Office of Long-Term Planning and Sustainability
Tools and technologies:
Agile iterations, Trello, Python, D3, CartoDB
Team:
Backend and CartoDB implementation: David Marulli
Frontend development: Chris Tull
Project Management and frontend development: Renate Pinggera