Academic Project
Reducing Delays of New York Buses
NYU, Center for Urban Science and Progress, 2015
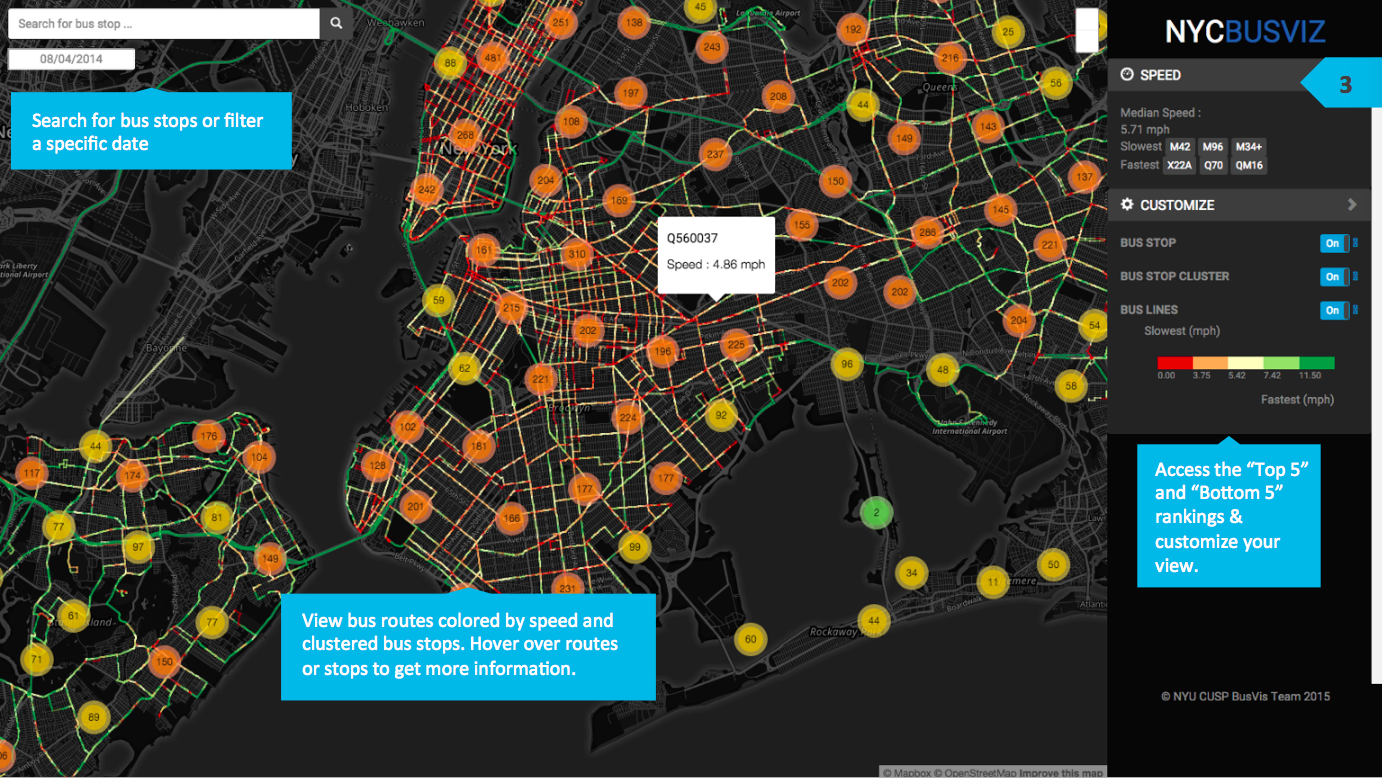
For my final project we analyzed New York City MTA bus data. Each of the roughly 4,500-5,000 daily buses pings its location every 30 seconds, generating over 400 million data points per day, requiring advanced data processing and geospatial analytical techniques.
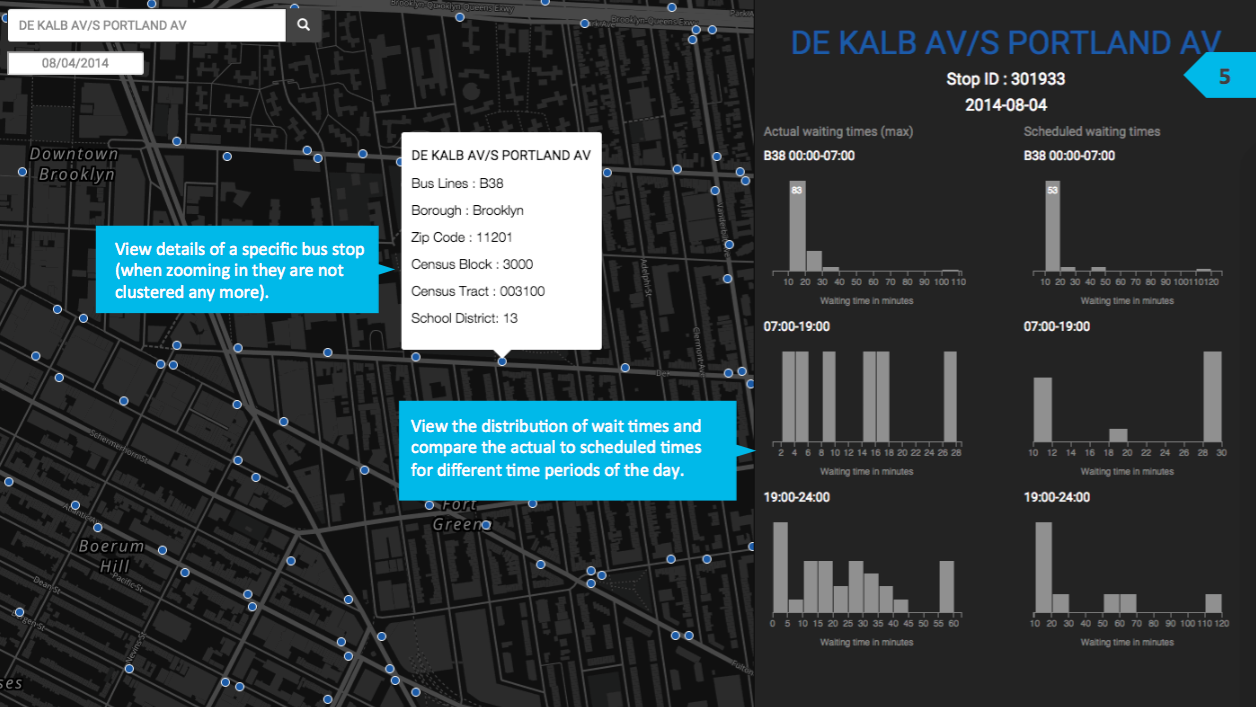
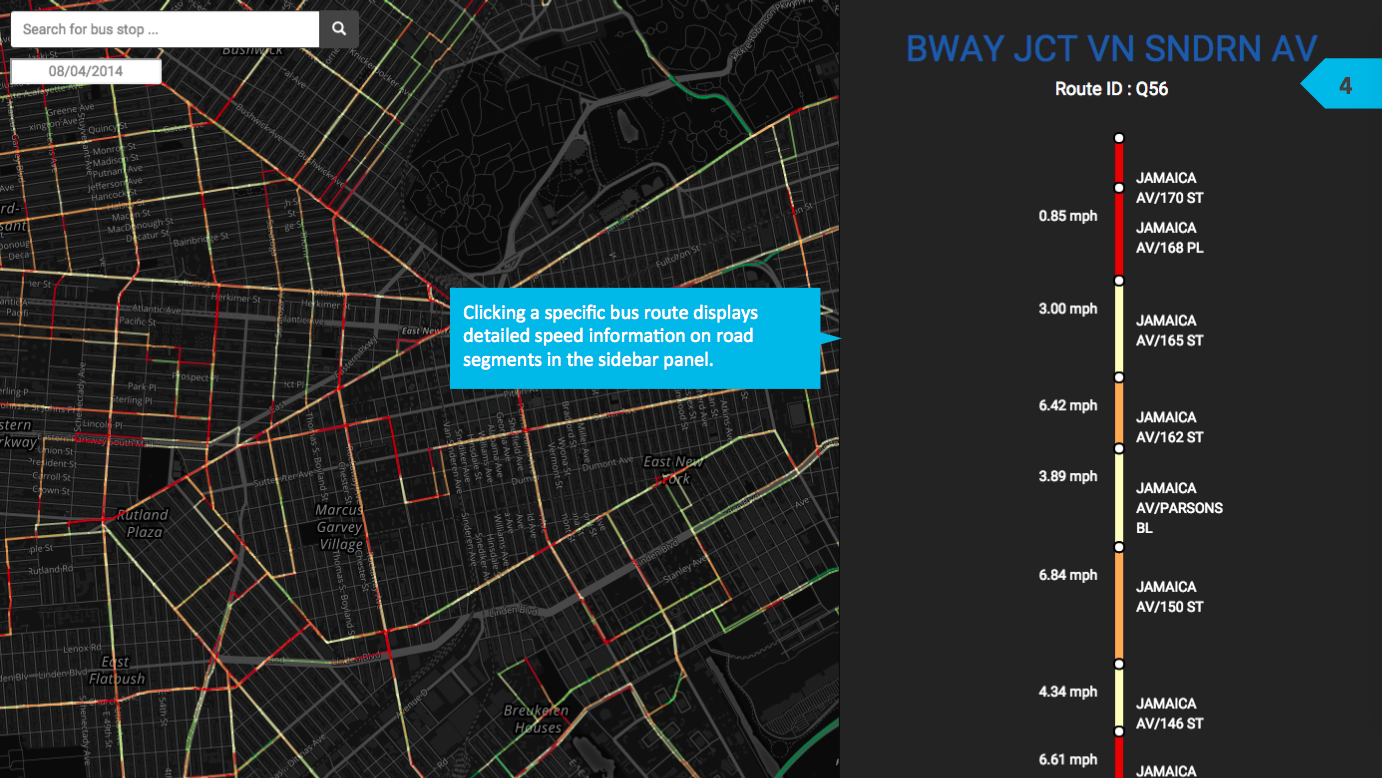
Our result is an interactive website that allows for user inquiry via visual data exploration, supported by accumulated bus data statistics. Our end-to-end solution is robust enough to scale to a data-driven interactive visualization tool, addressing users who face the challenge of improving the service levels of the New York City bus system, like MTA employees or staff members of a City agency.
My role:
Managing a team of 6 and implementing an online visualization tool for NY bus data.
Tools and technologies:
Scrum, Asana, Python, Python Flask, D3, Hadoop, and MapReduce
Team:
Data processing and backend engineering: Eduardo Franco, Dimas Rinarso Putro, Jiamin Xuan, Radu Stancut
Server architecture and middleware: Dimas Rinarso Putro
Frontend development and visualizations: Kania Azrina, Renate Pinggera
Graphics and screen design: Kania Azrina
Project management: Renate Pinggera